
*DataPoint* Allergies and Outliers
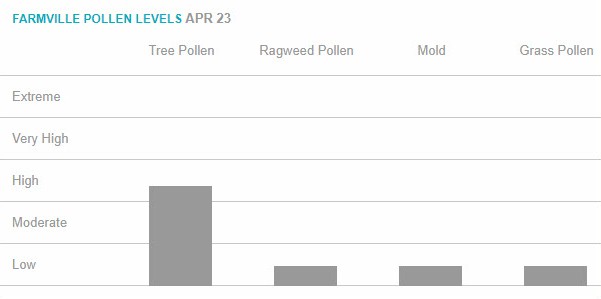
Andy is suffering from seasonal allergies but the allergy meter says pollen is low. What gives? Outliers. That’s what.
Here’s the bar chart to which Andy refers:
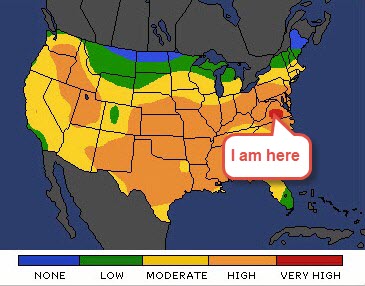
Here’s a pollen heat map:
About the author, Andy
Andy Leonard is a Microsoft Data Platform MVP, Chief Data Engineer at Enterprise Data & Analytics (EntDNA.com), SQL Server Integration Services (SSIS) and Business Intelligence Markup Language (Biml) trainer and consultant, author, engineer, and creator of the Data Integration Lifecycle Management Suite (dilmsuite.com).