*DataPoint* Allergies and Outliers
Andy is suffering from seasonal allergies but the allergy meter says pollen is low. What gives? Outliers. That’s what.
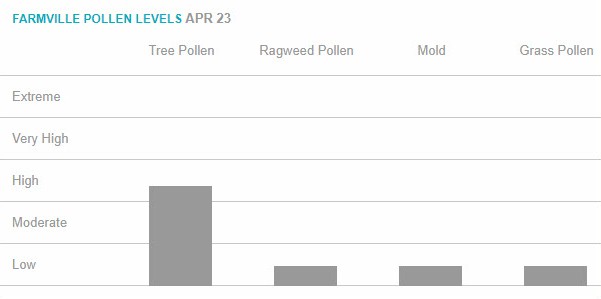
Here’s the bar chart to which Andy refers:
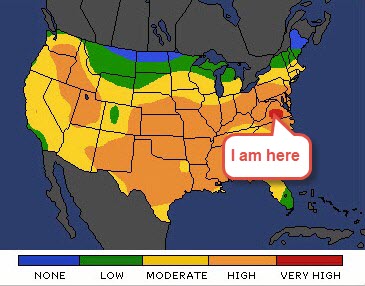
Here’s a pollen heat map:
Andy is suffering from seasonal allergies but the allergy meter says pollen is low. What gives? Outliers. That’s what.
Here’s the bar chart to which Andy refers:
Here’s a pollen heat map: